タイルパス→タイル位置ツール xyz.html
タイルパスをタイル位置に変換して地図上に表示する xyz.html を作成した。CC0。

http://handygeospatial.github.io/mapsites/xyz.html?16/58509/24181.png みたいな感じで、?の後ろにタイルパスを入れると、タイル矩形を地図に表現するだけの簡単なツールである。
ソース
<!doctype html>
<html>
<head>
<meta charset='UTF-8'>
<script src="http://leafletjs.com/dist/leaflet.js"></script>
<link rel="stylesheet" href="http://leafletjs.com/dist/leaflet.css">
<style>
body {padding: 0; margin: 0}
html, body, #map {height: 100%; width: 100%;}
.leaflet-container {background: #fff;}
</style>
</head>
<body>
<div id="map">
<script>
tile2lng = function(x, z) {
  return x / Math.pow(2, z) * 360 - 180;
}
tile2lat = function(y, z) {
  var n = Math.PI - 2 * Math.PI * y / Math.pow(2, z);
  return 180 / Math.PI * Math.atan(0.5 * (Math.exp(n) - Math.exp(-n)));
}

if(!document.location.href.split('?')[1]) {
  document.location.href += '?16/58509/24181.png';
}
var zxy = document.location.href.split('?')[1].split('/').map(parseFloat);
var lng0 = tile2lng(zxy[1], zxy[0]);
var lng1 = tile2lng(zxy[1] + 1, zxy[0]);
var lat0 = tile2lat(zxy[2] + 1, zxy[0]);
var lat1 = tile2lat(zxy[2], zxy[0]);
var bounds = [[lat0, lng0], [lat1, lng1]];

var map = L.map('map');
L.tileLayer('http://cyberjapandata.gsi.go.jp/xyz/std/{z}/{x}/{y}.png',
  {attribution: '地理院タイル'}).addTo(map);
L.rectangle(bounds, {color: "#ff7800", weight: 1}).addTo(map);
map.fitBounds(bounds);
</script>
</body>
</html>
リアルタイム・ベクトルタイル
リアルタイム・ベクトルタイルの実験をした。結果は http://handygeospatial.github.io/mapsites/2014/02/25/ 。
タイルデータサーバ
heroku で実装した。http://rtvt.herokuapp.com/xyz/11/1852/749.geojson といったアドレスにアクセスすれば、タイル内10点のランダムデータを返すというものだ。
heroku の具体的な使い方については、 http://i2bskn.hateblo.jp/entry/2013/06/11/000625 を参考にさせていただいた。
各ファイルの内容を紹介する。
app.rb
メインプログラム。
require 'bundler/setup'
require 'sinatra/base'
require 'json'

class App < Sinatra::Base
  def latlng(z, x, y)
    n = 2.0 ** z
    lng = 360.0 * x / n  - 180.0
    lat_rad = Math::atan(Math::sinh(Math::PI * (1 - 2 * y / n)))
    lat = 180.0 * (lat_rad / Math::PI)
    {:lat => lat, :lng => lng}
  end

  def extent(z, x, y)
    lower_corner = latlng(z, x, y + 1)
    upper_corner = latlng(z, x + 1, y)
    {:lat => lower_corner[:lat], :lng => lower_corner[:lng],
     :width => upper_corner[:lng] - lower_corner[:lng],
     :height => upper_corner[:lat] - lower_corner[:lat]}
  end

  def geojson(n, z, x, y)
    e = extent(z, x, y)
    json = {:type => 'FeatureCollection', :features => []}
    n.times {|i|
      json[:features] << {:type => 'Feature',
        :geometry => {:type => 'Point',
          :coordinates => [e[:lng] + rand * e[:width],
            e[:lat] + rand * e[:height]]},
        :properties => {:number => i + 1}}
    }
    JSON.dump(json)
  end

  get '/' do
    'Hi.'
  end

  get '/xyz/*.*' do
    headers['Access-Control-Allow-Origin'] = '*'
    (z, x, y) = params[:splat][0].split('/').map{|v| v.to_i}
    ext = params[:splat][1]
    geojson(10, z, x, y)
  end
end
Gemfile
source 'https://rubygems.org'
ruby '2.0.0'
gem 'sinatra'
gem 'json'
Procfile
web: bundle exec rackup config.ru -p $PORT
config.rb
$:.unshift(File.dirname(__FILE__))
require 'app'
run App
ウェブアプリケーション
http://handygeospatial.github.io/mapsites/2014/02/25/ に置いた。ソースは次の通り。
index.html
<!doctype html>
<html>
<head>
  <meta charset='UTF-8'>
  <meta name="viewport"
   content="width=device-width, initial-scale=1.0, maximum-scale=1.0, user-scalable=no">
  <meta name="apple-mobile-web-app-capable" content="yes"/>
  <meta name="apple-mobile-web-app-status-bar-style"
   content="black-translucent" />
  <title>リアルタイム・ベクトルタイル</title>
  <link rel='stylesheet' href='http://leafletjs.com/dist/leaflet.css'>
  <script src='http://leafletjs.com/dist/leaflet.js'></script>
  <script src="leaflet-hash.js"></script>
  <script src="TileLayer.GeoJSON.js"></script>
  <style>
  html, body, #mapdiv {margin: 0; padding: 0; width: 100%; height: 100%;}
  </style>
</head>
<body>
  <div id='mapdiv'/>
  <script>
function render_properties(prop) {
  var s = ''
  for(name in prop) {
    s += "<tr><td>" + name + "</td><td>" + prop[name] + "</td></tr>";
  }
  return "<table border='1'>" + s + "</table>";
}

icon = L.icon({iconUrl: 'http://cyberjapan.jp/symbols/129.bmp',
  iconSize: [20, 20]});
map = new L.Map('mapdiv', {zoom: 14, center: [35.6850, 139.7512]});
hash = new L.Hash(map);
map.addLayer(new L.TileLayer(
  'http://cyberjapandata.gsi.go.jp/xyz/std/{z}/{x}/{y}.png',
  {attribution: '地理院タイル'}));
layer = new L.TileLayer.GeoJSON(
  'http://rtvt.herokuapp.com/xyz/{z}/{x}/{y}.geojson',
  {attribution: 'リアルタイム・ベクトルタイル', unloadInvisibleTiles: true,
   minZoom: 11, maxZoom: 18},
  {style: {"clickable": true},
   onEachFeature: function(feature, layer) {
     layer.bindPopup(render_properties(feature.properties));
     layer.setIcon(icon);
   }
  });
map.addLayer(layer);
refresh = function() {layer.redraw(); setTimeout(refresh, 3000)};
refresh();
  </script>
</body>
</html>
国土数値情報(避難施設データ)のベクトルタイル変換
国土数値情報(避難施設データ)のベクトルタイル変換を行ってみた。国土数値情報(地価公示)データの変換と同じだが、47都道府県分一つ一つクリックする必要はある。OS Xの場合、~/Downloads フォルダに展開されるので、そこをスタートラインにして、次のスクリプトを実行した。
map.rb
require 'find'
require 'json'
require 'rubygems'
require 'geo_ruby'
require 'geo_ruby/shp'
include GeoRuby::Shp4r

module Math
  def self.sec(x)
    1.0 / cos(x)
  end
end

def process(r, z)
  n = 2 ** z
  lon_deg = r.geometry.x
  lat_rad = r.geometry.y * 2 * Math::PI / 360
  x = n * ((lon_deg + 180) / 360)
  y = n *
    (1 - (Math::log(Math::tan(lat_rad) + Math::sec(lat_rad)) / Math::PI)) / 2
  prop = {}
  r.data.attributes.each {|k, v|
    prop[k] = case v
    when 'true'
      true
    when 'false'
      false
    else
      s = v.to_s
      /^\d*$/.match(s) ? s.to_i : s
    end
  }
  f = {:type => 'Feature', :geometry => {:type => 'Point',
    :coordinates => [r.geometry.x, r.geometry.y]},
    :properties => prop}
  print [z, x.to_i, y.to_i, JSON.dump(f)].join("\t"), "\n"
end

Dir.glob('/Users/hfu/Downloads/P20-*') {|dir|
  Dir.glob("#{dir}/*.shp") {|path|
    ShpFile.open(path) {|shp|
      shp.each {|r|
        ARGV.each {|z| process(r, z.to_i)}
      }
    }
  }
}
reduce.rb
require 'fileutils'
require 'json'

last = nil
geojson = nil
$n_tiles = 0

def write(geojson, zxy)
  path = zxy.join('/') + '.geojson'
  print "writing #{geojson[:features].size} features to #{path}\n"
  [File.dirname(path)].each {|d| FileUtils.mkdir_p(d) unless File.exist?(d)}
  File.open(path, 'w') {|w| w.print(JSON.dump(geojson))}
  $n_tiles += 1
end

while gets
  r = $_.strip.split("\t")
  current = r[0..2].map{|v| v.to_i}
  if current != last
    write(geojson, last) unless last.nil?
    geojson = {:type => 'FeatureCollection', :features => []}
  end
  geojson[:features] << JSON.parse(r[3])
  last = current
end
write(geojson, last)
print "finished. #{$n_tiles} tiles written.\n"
実行
$ ruby map.rb 14 | sort | ruby reduce.rb
これでズームレベル14のベクトルタイルが作成される。34684タイル。
MapReduce的ベクトルタイル作成(地価公示)Pt. 5
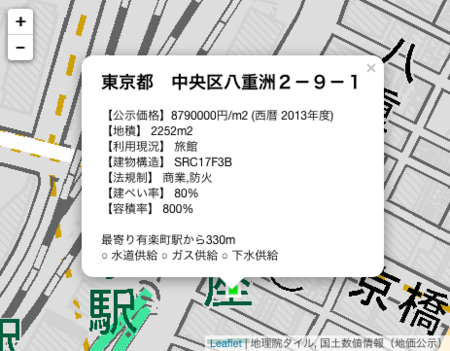
その後、属性表示がもう少し human readable になるように改造してみた。
http://handygeospatial.github.io/mapsites/2014/02/12/

変更点
変更点は、関数 render_properties の内容だけである。次のように書き換えた。
function render_properties(prop) {
  var s = '';
  s += '<h3>' + prop['L01_019'] + '</h3>';
  s += '【公示価格】' + prop['L01_006'] + '円/m2 (' +
    prop['L01_005'] + '年度)<br>';
  s += '【地積】 ' + prop['L01_020'] + 'm2<br>';
  s += '【利用現況】 ' + prop['L01_021']+ '<br>';
  s += '【建物構造】 ' + prop['L01_023']+ '<br>';
  s += '【法規制】 ' + prop['L01_029'] + '<br>';
  s += '【建ぺい率】 ' + prop['L01_030'] + '%<br>';
  s += '【容積率】 ' + prop['L01_031'] + '%<br><br>';
  s += '最寄り' + prop['L01_027'] + '駅から' + prop['L01_028'] + 'm<br>';
  s += (prop['L01_024'] ? '○' : '×') + ' 水道供給 ';
  s += (prop['L01_025'] ? '○' : '×') + ' ガス供給 ';
  s += (prop['L01_026'] ? '○' : '×') + ' 下水供給<br>';
  return s;
}
MapReduce的ベクトルタイル作成(地価公示)Pt. 4
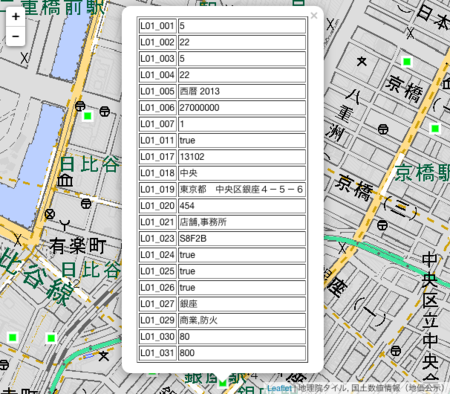
間があいてしまったが、前回作成したベクトルタイルデータを表示する。
http://handygeospatial.github.io/mapsites/2014/02/11/ の解説である。

ソースコード
index.html のソースコードは、次の通りである。その他、leaflet-hash.js と TileLayer.GeoJSON.js を同フォルダにアップロードしてある。
<!doctype html>
<html>
<head>
  <meta charset='UTF-8'>
  <meta name="viewport"
   content="width=device-width, initial-scale=1.0, maximum-scale=1.0, user-scalable=no">
  <meta name="apple-mobile-web-app-capable" content="yes"/>
  <meta name="apple-mobile-web-app-status-bar-style"
   content="black-translucent" />
  <title>国土数値情報(地価公示)</title>
  <link rel='stylesheet' href='http://leafletjs.com/dist/leaflet.css'>
  <script src='http://leafletjs.com/dist/leaflet.js'></script>
  <script src="leaflet-hash.js"></script>
  <script src="TileLayer.GeoJSON.js"></script>
  <style>
  html, body, #mapdiv {margin: 0; padding: 0; width: 100%; height: 100%;}
  </style>
</head>
<body>
  <div id='mapdiv'/>
  <script>
function _tr(prop, name) {
  if(prop[name] == '' || prop[name] == undefined) {
    return '';
  } else {
    return "<tr><td>" + name + "</td><td>" + prop[name] + "</td></tr>";
  }
}

function render_properties(prop) {
  var s = ''
  for(i in prop) {
    s += _tr(prop, i);
  }
  return "<table border='1'>" + s + "</table>";
}

icon = L.icon({
  iconUrl: 'http://cyberjapan.jp/symbols/090.bmp', iconSize: [16, 16]});
map = new L.Map('mapdiv', {zoom: 16, center: [35.6762, 139.7653]});
hash = new L.Hash(map);
map.addLayer(new L.TileLayer(
  'http://cyberjapandata.gsi.go.jp/xyz/pale/{z}/{x}/{y}.png',
  {attribution: '地理院タイル'}));
map.addLayer(new L.TileLayer.GeoJSON(
  'http://www.handygeospatial.info/2014/01/22/{z}/{x}/{y}.geojson',
  {attribution: '国土数値情報(地価公示)', unloadInvisibleTiles: true,
   minZoom: 14, maxZoom: 18},
  {style: {"clickable": true},
   onEachFeature: function(feature, layer) {
     layer.bindPopup(render_properties(feature.properties));
     layer.setIcon(icon);
   }
  }));
  </script>
</body>
</html>
部分ごとの解説
<!doctype html>
<html>
<head>
  <meta charset='UTF-8'>
  <meta name="viewport"
   content="width=device-width, initial-scale=1.0, maximum-scale=1.0, user-scalable=no">
  <meta name="apple-mobile-web-app-capable" content="yes"/>
  <meta name="apple-mobile-web-app-status-bar-style"
   content="black-translucent" />
  <title>国土数値情報(地価公示)</title>
普通のHTMLの記述である。マルチタップデバイスでも動作することをめざして、その辺りのメタ情報を加えてある。
  <link rel='stylesheet' href='http://leafletjs.com/dist/leaflet.css'>
  <script src='http://leafletjs.com/dist/leaflet.js'></script>
  <script src="leaflet-hash.js"></script>
  <script src="TileLayer.GeoJSON.js"></script>
必要なウェブ地図ライブラリをロードしている。
  <style>
  html, body, #mapdiv {margin: 0; padding: 0; width: 100%; height: 100%;}
  </style>
</head>
<body>
  <div id='mapdiv'/>
  <script>
フルスクリーンのLeafletサイトを作成するときの定番のスタイルシート記述である。地図ディビジョンに全画面を割り当てている。
function render_properties(prop) {
  var s = ''
  for(name in prop) {
    s += "<tr><td>" + name + "</td><td>" + prop[name] + "</td></tr>";
  }
  return "<table border='1'>" + s + "</table>";
}
属性吹き出しの中身を作成するための関数である。render_propertiesは、地物属性のオブジェクトをRubyのHashオブジェクト風に受け取り、それぞれのキーごとに、HTMLのtrを作成させ、tableに入れて返す。
icon = L.icon({
  iconUrl: 'http://cyberjapan.jp/symbols/090.bmp', iconSize: [16, 16]});
ポイントデータにあとで割り当てるアイコンを設定している。iconUrlはアイコンのURLである。iconSizeはアイコンのサイズである。アイコンのサイズを指定することで、アイコンの中央がデータ上の点になる。アイコンのサイズを指定しなかった場合、アイコン画像の左上がデータ上の点になったと思う。
map = new L.Map('mapdiv', {zoom: 16, center: [35.6762, 139.7653]});
初期位置を明示して、地図ディビジョンを作成している。URLにハッシュが含まれていない場合には、この初期位置が使われることになる。
hash = new L.Hash(map);
leaflet-hash を地図ディビジョンに設定している。URLにハッシュが含まれる場合には、初期位置がそこに変更されるし、地図がスクロールするごとにURL上のハッシュが変更されることになる。結果として、任意の地図表示の際にアドレスバーからURLをコピーすると、現在の地図表示がURLに埋め込まれることになる。
map.addLayer(new L.TileLayer(
  'http://cyberjapandata.gsi.go.jp/xyz/pale/{z}/{x}/{y}.png',
  {attribution: '地理院タイル'}));
地理院タイル「淡色地図」を地図ディビジョンに加えている。ごくふつうの画像タイルである。
map.addLayer(new L.TileLayer.GeoJSON(
  'http://www.handygeospatial.info/2014/01/22/{z}/{x}/{y}.geojson',
  {attribution: '国土数値情報(地価公示)', unloadInvisibleTiles: true,
   minZoom: 14, maxZoom: 18},
  {style: {"clickable": true},
   onEachFeature: function(feature, layer) {
     layer.bindPopup(render_properties(feature.properties));
     layer.setIcon(icon);
   }
  }));
先日来作成していた「国土数値情報(地価公示)」のベクトルタイルを地図ディビジョンに追加する。
L.TileLayer.GeoJSONのコンストラクタは3つの引数を取る。1つめは普通通りのURLテンプレートであり、2つめは比較的標準的なプロパティ(GeoJSONTileLayer options)であり、3つめがベクトルタイル特有のプロパティ(GeoJSON options)である。オリジナルの技術情報は https://github.com/glenrobertson/leaflet-tilelayer-geojson/ にある。
3つめのプロパティ(GeoJSON options)で style: {"clickable": true} とすることにより、該当するアイコンがクリック選択になる。クリック選択後のアクションなど、地物ごとの設定を行うのが、onEachFeature プロパティである。ここでは、bindPopup で、先ほどの関数 render_properties を用いてポップアップの内容を設定し、setIcon でアイコンを設定している。
MapReduce的ベクトルタイル作成(地価公示)Pt. 3
データをAWS S3にputする。
データの作成
これまで作成したプログラムmap.rb及びreduce.rbを使って、次の通りズームレベル14〜18のGeoJSONベクトルタイルを作成した。
$ ruby map.rb 14 | sort | ruby reduce.rb
$ ruby map.rb 15 | sort | ruby reduce.rb
$ ruby map.rb 16 | sort | ruby reduce.rb
$ ruby map.rb 17 | sort | ruby reduce.rb
$ ruby map.rb 18 | sort | ruby reduce.rb
データの転送
作成したファイルの作図を確認すると数百MBの程度であったので、すべてAWS S3にputした。
事前に、AWS S3コンソールにs3://www.handygeospatial.info/2014/01/22/を作成している。
$ s3cmd sync 14 s3://www.handygeospatial.info/2014/01/22/
$ s3cmd sync 15 s3://www.handygeospatial.info/2014/01/22/
$ s3cmd sync 16 s3://www.handygeospatial.info/2014/01/22/
$ s3cmd sync 17 s3://www.handygeospatial.info/2014/01/22/
$ s3cmd sync 18 s3://www.handygeospatial.info/2014/01/22/
転送後、AWS S3コンソールでmake publicにして終了。例えば、次のようなデータが上がっていることが分かる。
http://www.handygeospatial.info/2014/01/22/14/14001/6955.geojson
国土数値情報(地価公示データ) 国土交通省
ホスト料金の相場観
必要コストの規模感を共有するために、1/22時点の1月のBillsから、AWS S3(Tokyo)のBillsの数値を共有する。
- $0.005 per 1,000 PUT, COPY, POST, or LIST requests 36,312 Requests $0.18
- $0.004 per 10,000 GET and all other requests 31,361 Requests $0.01
- $0.100 per GB - first 1 TB / month of storage used 0.771 GB-Mo $0.08
これらの合計で$0.27。約27円をかけている。これらが、先日のバス停、バスルートや小学校区のベクトルタイルをホストする場合のおおよそのコスト感になる。
PUTのコストについては、EC3から転送することで圧縮できることが知られているが、いずれにせよ小さい金額なのでここの改善はしていない。EC3インスタンスをupしたまま放置してしまってコストをかけてしまうリスクもある。しかし、そのうち改善するかもしれない。つまり、転送のタイミングで起動するEC2インスタンスに圧縮ファイルなりで一旦転送し、EC2インスタンスで展開しながらS3にアップロードし、自動的にEC2インスタンスを停止させるような方法を試すかもしれない。VagrantでEC2を起こす方法があるらしいので、それを使うかもしれない。
c.f. Vagrant 1.1 で EC2 を vagrant up - naoyaのはてなダイアリー
MapReduce的ベクトルタイル作成(地価公示)Pt. 2
ついでreduce.rbを紹介し、実際にタイルを作成する。
reduce.rb
ソートされ、タイルごとに並んでいるデータをTileJSONに書き出すだけの簡単なプログラム。
require 'fileutils'
require 'json'

last = nil
geojson = nil
$n_tiles = 0

def write(geojson, zxy)
  path = zxy.join('/') + '.geojson'
  print "writing #{geojson[:features].size} features to #{path}\n"
  [File.dirname(path)].each {|d| FileUtils.mkdir_p(d) unless File.exist?(d)}
  File.open(path, 'w') {|w| w.print(JSON.dump(geojson))}
  $n_tiles += 1
end

while gets
  r = $_.strip.split("\t")
  current = r[0..2].map{|v| v.to_i}
  if current != last
    write(geojson, last) unless last.nil?
    geojson = {:type => 'FeatureCollection', :features => []}
  end
  geojson[:features] << JSON.parse(r[3])
  last = current
end
write(geojson, last)
print "finished. #{$n_tiles} tiles written.\n"
map.rb(多少改造)
前回紹介したmap.rbについて、ズームレベルをコマンドライン指定できるよう多少改造。
require 'find'
require 'json'
require 'rubygems'
require 'geo_ruby'
require 'geo_ruby/shp'
include GeoRuby::Shp4r

module Math
  def self.sec(x)
    1.0 / cos(x)
  end
end

def process(r, z)
  n = 2 ** z
  lon_deg = r.geometry.x
  lat_rad = r.geometry.y * 2 * Math::PI / 360
  x = n * ((lon_deg + 180) / 360)
  y = n *
    (1 - (Math::log(Math::tan(lat_rad) + Math::sec(lat_rad)) / Math::PI)) / 2
  prop = {}
  r.data.attributes.each {|k, v|
    prop[k] = case v
    when 'true'
      true
    when 'false'
      false
    else
      s = v.encode('UTF-8', 'CP932')
      /^\d*$/.match(s) ? s.to_i : s
    end
  }
  f = {:type => 'Feature', :geometry => {:type => 'Point',
    :coordinates => [r.geometry.x, r.geometry.y]},
    :properties => prop}
  print [z, x.to_i, y.to_i, JSON.dump(f)].join("\t"), "\n"
end

ShpFile.open('L01-13.shp') {|shp|
  shp.each {|r|
    ARGV.each {|z| process(r, z.to_i)}
  }
}
補足であるが、x,yの算出式については、 Slippy map tilenames - OpenStreetMap Wiki が出典である。
実行
ズームレベル14のタイルを作成するには、このようにする。
$ ruby map.rb 14 | sort | ruby reduce.rb
手元のMacBook Airの場合、21秒程度で9373タイルが生成された。