ベクトルタイル・いちさと(小学校区)Pt. 2 ベクトルタイルデータを用意し確認するまで
タイルデータの作成
作成したShapefileを対象とする tilestache.cfg を作成したところ、次のとおり。
{"cache": {
  "name": "Disk",
  "path": "/vagrant/es",
  "dirs": "portable",
  "gzip": []
  },
 "layers": {
  "school_district": {
    "provider": {"name": "vector", "driver": "ESRI Shapefile", "verbose": true,
      "parameters": {
        "file": "school_district.shp"},
        "properties": ["id", "A27_005", "A27_006", "A27_007", "A27_008"]
      }
    }
  }
}これを、次のRakefileを通じて、vagrant-webmaps上のでtilestache-seed.pyでタイル化する。これまで作業してきたフォルがが、vagrant-webmaps上では/vagrant/esに見えるようにしてある。
task :default do
  sh "tilestache-seed.py -b 35.66811 139.233398 36.153059 140.914307 -c tilestache.cfg -l school_district 15"
end
vagrant@precise32:/vagrant/es$ rake
tilestache-seed.py -b 35.66811 139.233398 36.153059 140.914307 -c tilestache.cfg -l school_district 15
1 of 8470... school_district/15/29057/12850.geojson (7KB)
2 of 8470... school_district/15/29058/12850.geojson (4KB)
3 of 8470... school_district/15/29059/12850.geojson (3KB)
4 of 8470... school_district/15/29060/12850.geojson (4KB)
...
>
これで、ベクトルタイルは作成できた。
(バスルートデータと比べると桁違いに速い)
タイルデータの確認
実際にウェブ地図で表示してみる。
次のindex.htmlを用いる。JavaScriptファイルは、github.ioにホストしてもらっているものを絶対URL参照で見て頂けるようにしている*1ので、このindex.htmlだけが要作成のコンテンツである。
<!doctype html>
<html>
<head>
  <!-- thx https://github.com/ebrelsford/leaflet-tilelayer-vector -->
  <meta charset='UTF-8'>
  <meta name="viewport"
   content="width=device-width, initial-scale=1.0, maximum-scale=1.0, user-scalable=no">
  <meta name="apple-mobile-web-app-capable" content="yes"/>
  <meta name="apple-mobile-web-app-status-bar-style"
   content="black-translucent" />
  <link rel="apple-touch-icon"
   href="https://si0.twimg.com/profile_images/666603054/r.png"/>
  <title>ベクトルタイル・いちさと(小学校区)</title>
  <link rel='stylesheet' href='http://cdn.leafletjs.com/leaflet-0.7/leaflet.css'>
  <link rel="stylesheet" href="http://leaflet.github.io/Leaflet.label/leaflet.label.css">
  <script src='http://cdn.leafletjs.com/leaflet-0.7/leaflet.js'></script>
  <script src="http://leaflet.github.io/Leaflet.label/leaflet.label.js"></script>
  <script src="http://handygeospatial.github.io/mapsites/2014/01/01/communist.min.js"></script>
  <script src="http://handygeospatial.github.io/mapsites/2014/01/01/TileCache.js"></script>
  <script src="http://handygeospatial.github.io/mapsites/2014/01/01/TileQueue.js"></script>
  <script src="http://handygeospatial.github.io/mapsites/2014/01/01/AbstractWorker.js"></script>
  <script src="http://handygeospatial.github.io/mapsites/2014/01/01/CommunistWorker.js"></script>
  <script src="http://handygeospatial.github.io/mapsites/2014/01/01/TileLayer.GeoJSON.js"></script>
  <script src="http://handygeospatial.github.io/mapsites/2014/01/01/TileLayer.Overzoom.js"></script>
  <script src="http://handygeospatial.github.io/mapsites/2014/01/01/Leaflet.label-patch.js"></script>
  <script src="http://handygeospatial.github.io/mapsites/2014/01/01/leaflet-hash.js"></script>
  <style>
  html, body, #mapdiv {margin: 0; padding: 0; width: 100%; height: 100%;}
  </style>
</head>
<body>
  <div id='mapdiv'/>
  <script>
map = new L.Map('mapdiv', {zoom: 15, center:
  [(35.66811 + 36.153059) / 2 , (139.233398 + 140.914307) / 2]});
hash = new L.Hash(map);
map.addLayer(new L.TileLayer(
  'http://cyberjapandata.gsi.go.jp/xyz/std/{z}/{x}/{y}.png',
  {attribution: '地理院タイル', minZoom: 2}));
map.addLayer(new L.TileLayer.Vector(
  './{z}/{x}/{y}.geojson',
  {attribution: '国土数値情報(小学校区データ) 国土交通省',
   unloadInvisibleTiles: true, minZoom: 15,
   serverZooms: [15]},
  {style: {
        "clickable": true,
        "color": "#00F",
        "fillColor": "#00F",
        "weight": 5.0,
        "opacity": 0.3,
        "fillOpacity": 0.2
    },
   onEachFeature: function(feature, layer) {
     layer.bindPopup("id: " + feature.properties.id +
                     "<br/>市区町村コード: " + feature.properties.A27_005 +
                     "<br/>設置主体: " + feature.properties.A27_006 +
                     "<br/>名称: " + feature.properties.A27_007+
                     "<br/>所在地: " + feature.properties.A27_008);
   }
  }));
  </script>
</body>
</html>
タイルデータがCORS対応していないといけないので、次のRakefileを通じてSinatraでホストする。Ruby にまだ Sinatra を入れていない方は、gem install sinatra が必要となる。
require 'rubygems'
require 'sinatra/base'

class App < Sinatra::Base
  get '/' do
    File.open('index.html').read
  end

  get '/*/*/*.geojson' do
    headers({"Access-Control-Allow-Origin" => "*"})
    path = "#{params[:splat].join('/')}.geojson"
    if File.exist?(path)
      File.open(path).read
    else
      '{"type": "FeatureCollection", "features": []}'
    end
  end
end

task :default do
  App.run!
end
solid-state-survivor:school_district hfu$ rake
== Sinatra/1.1.0 has taken the stage on 4567 for development with backup from Thin
Thin web server (v1.6.1 codename Death Proof)
Maximum connections set to 1024
Listening on 0.0.0.0:4567, CTRL+C to stop
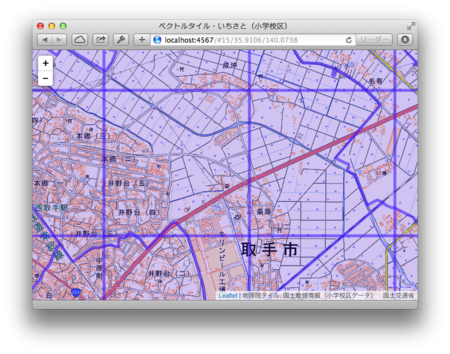
これでlocalhost:4567を見ると、とりあえず下の図のようにベクトルタイルが表示されていることを確認することができるようになる。

ウェブ地図として見られるようにする作業は、これからだ。index.html に手を入れることになる。